Case study · Plant operations platform · 2026
Durus Running a galvanizing plant on one screen
Rebuilding the order-to-invoice workflow of a hot-dip galvanizing plant — turning five disconnected paper-and-spreadsheet steps into one desktop system that tracks every order from intake to the plating line to the invoice.
01
Overview
Project info
Durus is an internal desktop application built for a hot-dip galvanizing plant — the factory process that coats steel parts in zinc to stop them rusting. It runs the full order lifecycle: customer orders, incoming-goods check-in, QC “black inspection,” the eight-stage plating line, checkout and invoicing. I led design for a ground-up redesign of the core operational surfaces, owning both the hands-on work and the design direction for a cross-functional team of 3 designers (I led), 1 developer and 1 PM, working alongside planners, QC inspectors and floor operators who use the app every shift.
02
The challenge
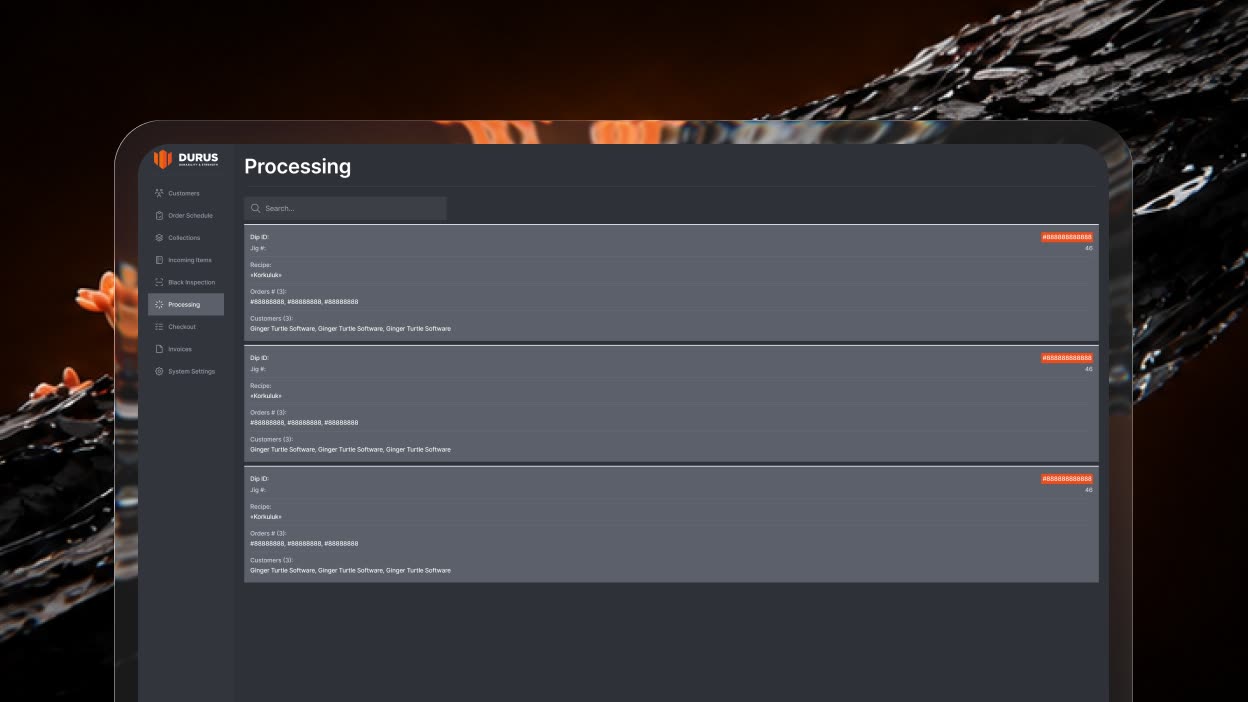
The plant ran a real, physical production line, but the software tracking it didn’t reflect how galvanizing actually works. Orders, jigs and quality checks lived in separate lists with no shared state — so a planner couldn’t see where a job sat on the line, and a re-dip meant someone finding out by walking the floor.
- Invisible process
- The plating line has eight physical stages — hanging, degreasing, pickling, galvanising, dispatching and more — but the software only showed “in progress” or “done.” No one could see a jig’s real position without walking out to look.
- No domain logic
- Recipes, gauge, size and hangability determine how a part is actually dipped, but intake was a bare form — the same screen for a light bracket and a heavy structural beam.
- Disconnected records
- Customer pricing, order history and QC evidence lived in different places, so planners and finance re-asked the same questions on every call.
03
The before
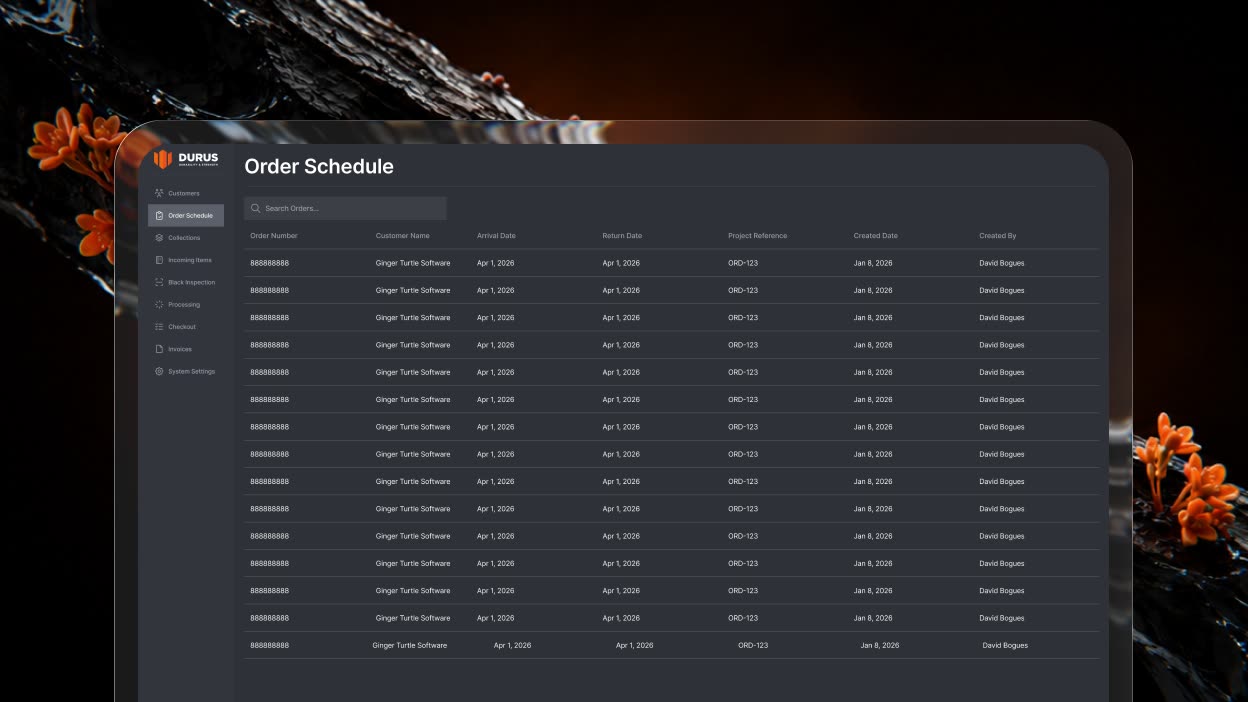
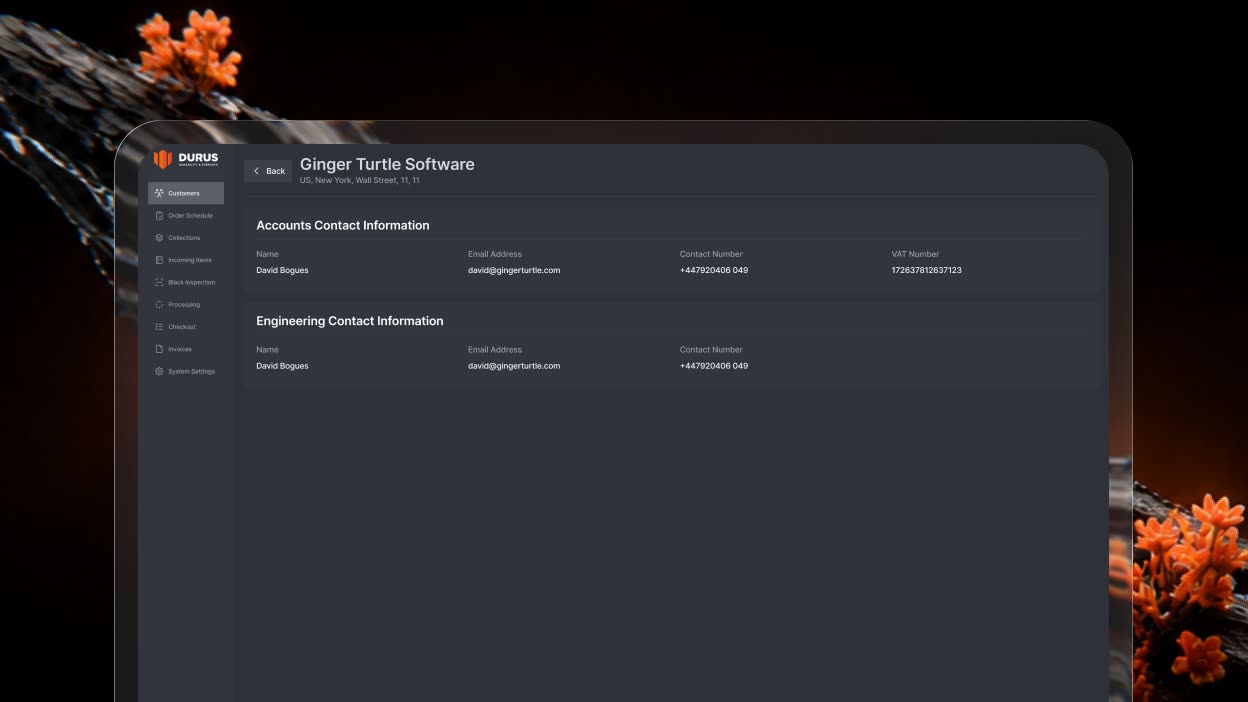
What the core plant-floor screens looked like before the redesign — flat lists with no process tracking, no filtering, no domain logic, and no evidence trail.
04
Approach
-
Research
Phase 01 · research Discovery
Spent time on the plant floor with QC inspectors, planners and line operators, and walked the physical galvanizing line stage by stage. Found the same job being tracked three different ways — a paper traveller on the floor, a spreadsheet in the office, and a memory in someone’s head.
-
Information architecture
Phase 02 · information architecture Structure
plating stages modelled into one order record
We re-modelled the order as the spine of the whole system, not a row in a spreadsheet. An order now carries its customer, its materials and recipes, its position across the eight-stage plating line, and its invoice — so a stage change on the shop floor, a QC approval and a finance update all move the same record instead of three disconnected ones.
-
Systems & leadership
Phase 03 · systems & leadership Scale
As team lead, I set the direction for three designers and built a shared component system (stage cards, status pipelines, filter bars, evidence panels) so development shipped consistently across intake, processing, QC and invoicing without the app fragmenting screen to screen.
-
Prototyping & validation
Phase 04 · prototyping & validation Proof
Tested the Processing board and the Black Inspection flow with real operators and inspectors on the floor; iterated the jig-readiness indicator and the photo-evidence step until both felt fast enough to use mid-shift, not just correct on paper.
We stopped tracking paperwork about the process and started modelling the process itself.
05
The solution
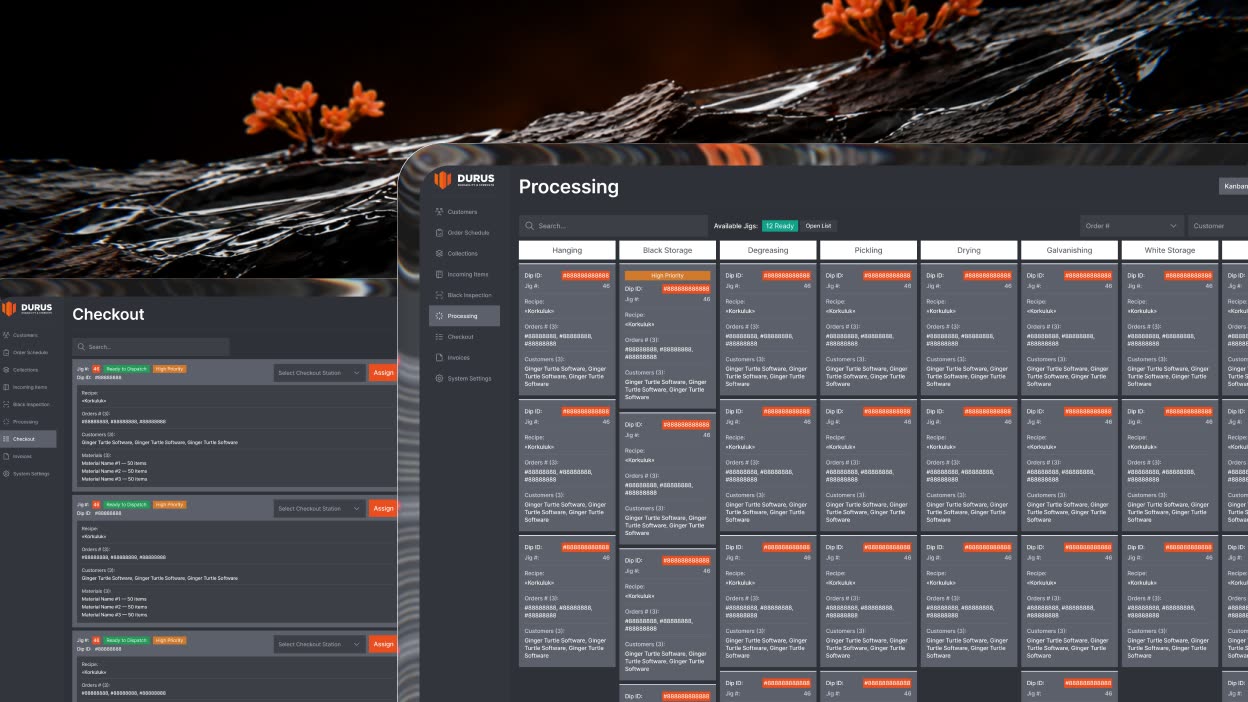
A processing board that matches the real line
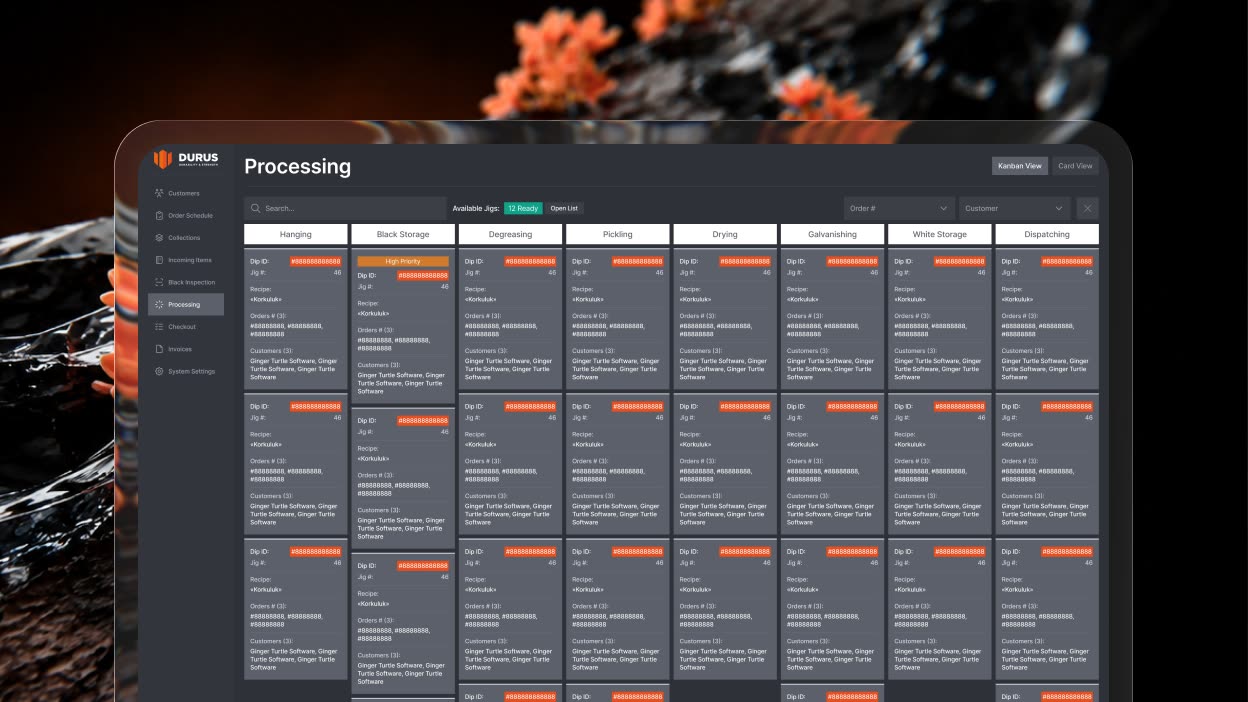
An eight-stage Kanban — hanging through dispatching — with live jig-readiness, recipe grouping and priority bands turns a flat job list into a real-time picture of the plating line, so a planner can see exactly where every dip sits without walking the floor.
An order schedule planners can act on
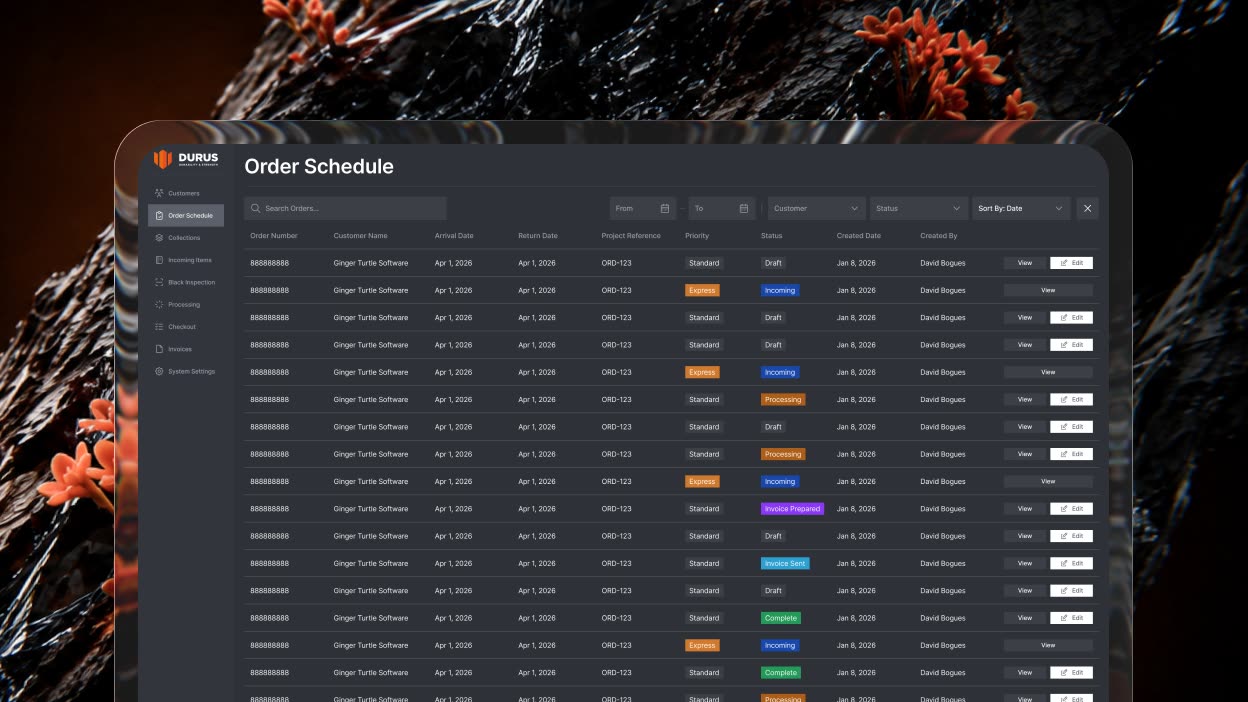
Filters, a colour status pipeline and per-row actions turn a static order list into something a planner operates — check status, adjust priority and release a job to the line without leaving the table.
A customer hub, not a contact card
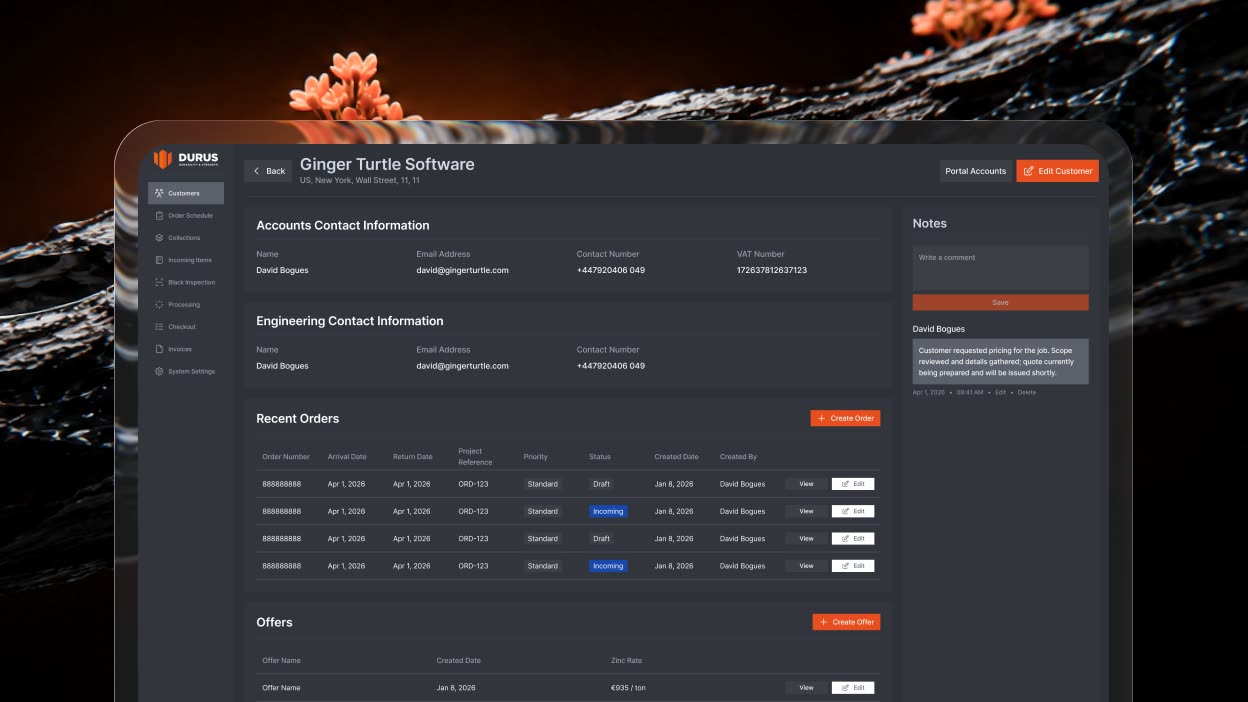
Contacts, recent orders, zinc-rate offers and notes now live on one record, so a planner or account handler answers “what’s this customer’s history and pricing?” in one screen instead of three.
QC that understands the process
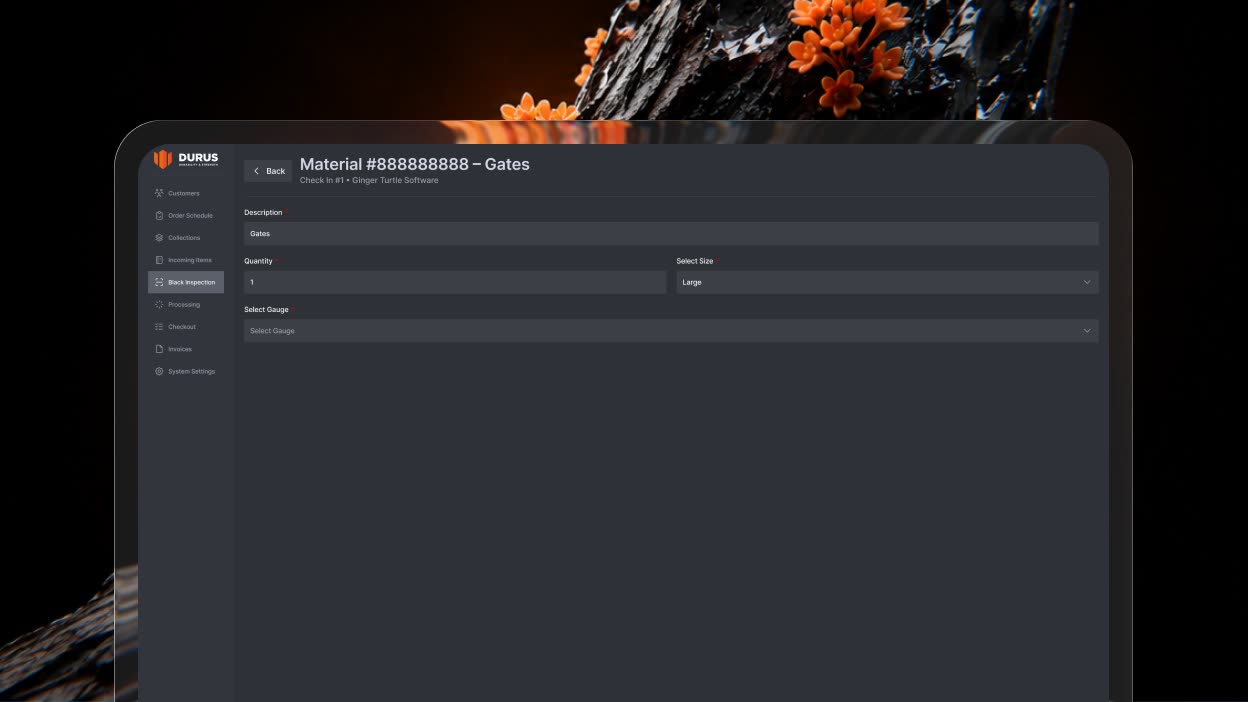
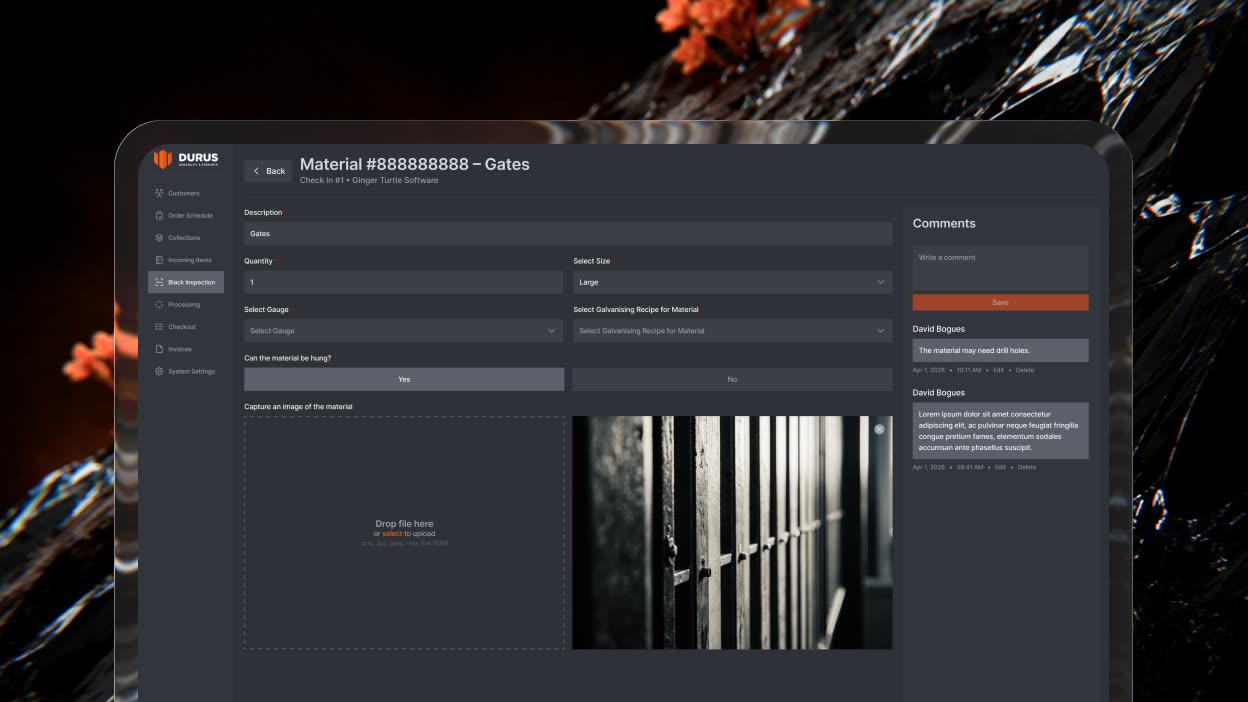
Recipe linkage, a hangability check, photo evidence and an approve step turn black inspection from a data-entry stub into a domain-aware QC workflow with a defensible audit trail — built around how galvanizing QC actually works, not a generic form.
06
Results
Within two quarters, the plant stopped running on paper travellers and started running on one system. Planners could see a job’s real position on the line instead of asking the floor, QC inspectors closed a black inspection with evidence attached in a fraction of the time, and finance moved from checkout to invoice in days instead of the better part of a week — while the line itself ran fuller, with fewer idle jigs between stages.
07
Reflection
The main task was mapping the plant's real workflow, stage by stage, so the software matched what happens to a batch of steel from intake to dispatch. The order and process data model made the difference. Once a job's recipe, stage and QC status lived on one record, the board, the schedule, the inspection and the invoice all had accurate information to show. If I ran it again, I would sit with operators and inspectors while the structure was still being decided. The stage model held up because the people running the line agreed on it before we drew any screens.
08
Let’s Connect
Looking for a designer who can bring clarity to complex products and improve business outcomes? Let’s connect.
Download CV