Case study · Security Awareness Platform · 2026
Awareness10 Security awareness training
Turning a scattered set of phishing, training and survey campaigns into one measurable human-risk system — where every campaign rolls up into a single organization risk score security leaders can act on.
01
Overview
Project info
Awareness10 is an enterprise security awareness training and human risk management platform. Admins run phishing simulations, training and awareness campaigns, surveys, USB-drop tests and policy attestation across their workforce — all rolling up into one analytics dashboard. I led design for a ground-up redesign of the core reporting and campaign surfaces, owning both the hands-on work and the design direction for a cross-functional team of four designers.
02
The challenge
The platform ran real programs, but the data behind them didn’t connect. Phishing results, training completion and awareness activity lived in separate tables with no shared score — so admins could report what happened, but not whether the organization was actually getting safer.
- Fragmentation
- Phishing, training, awareness and survey campaigns each reported in isolation, with no shared metric to compare them.
- No risk signal
- Raw counts (sent, opened, completed) had no interpretation — nothing told an admin if the org was safer than last quarter.
- Audit pressure
- Security leads needed defensible, exportable evidence fast, but assembling a coverage report meant stitching several screens by hand.
03
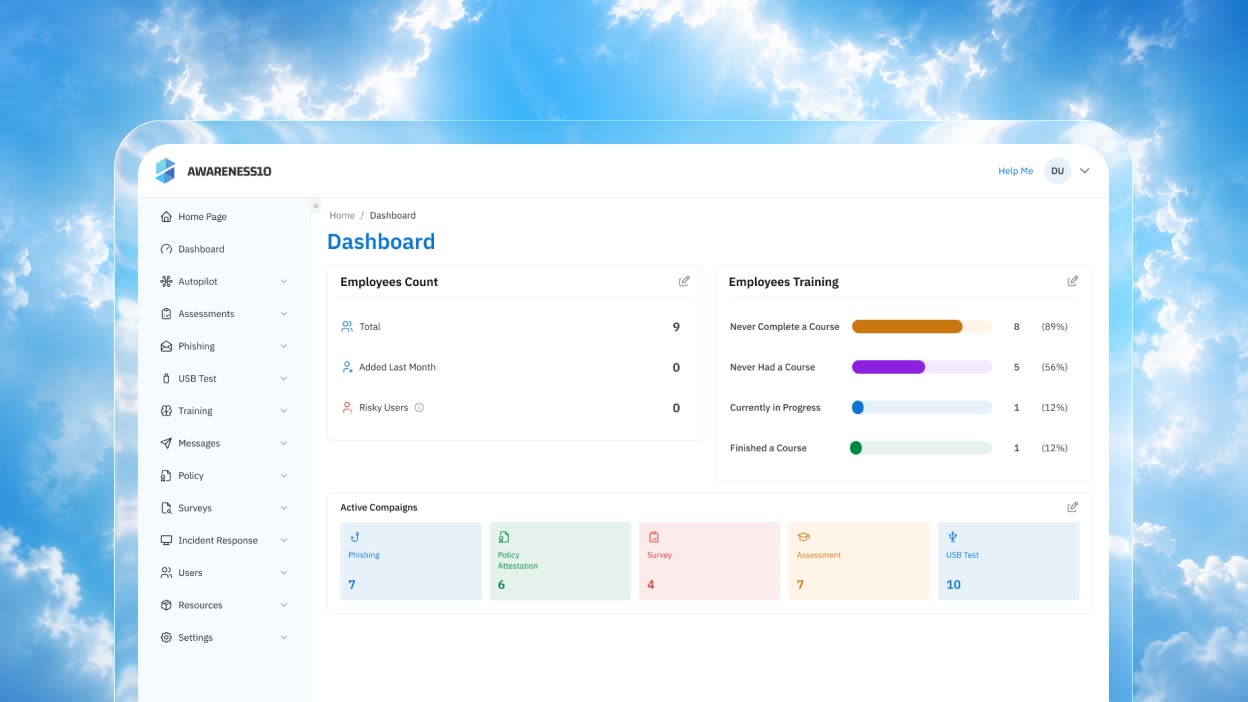
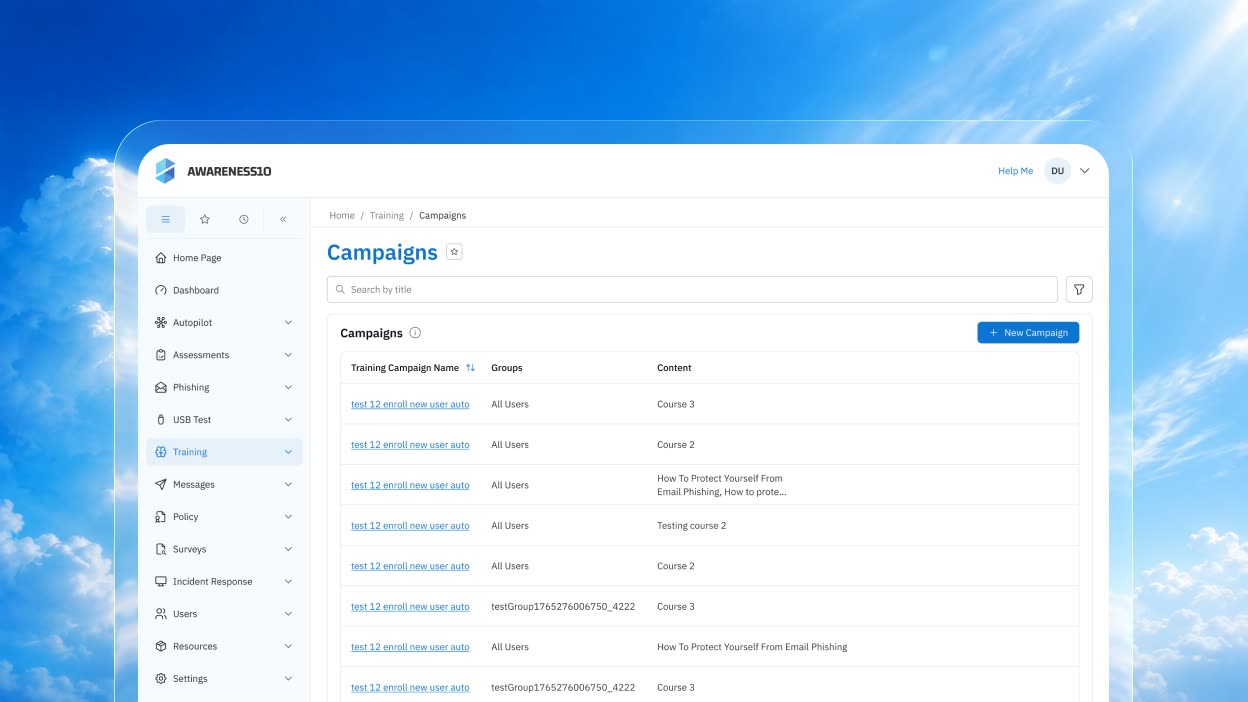
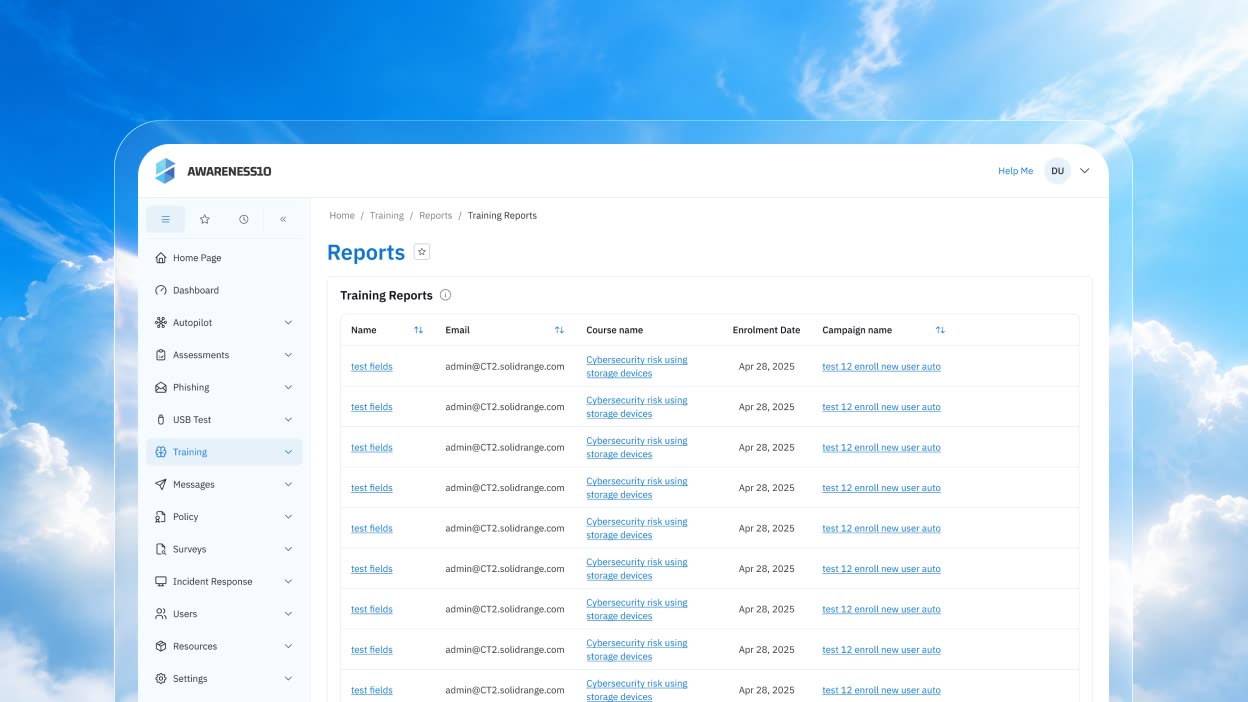
The before
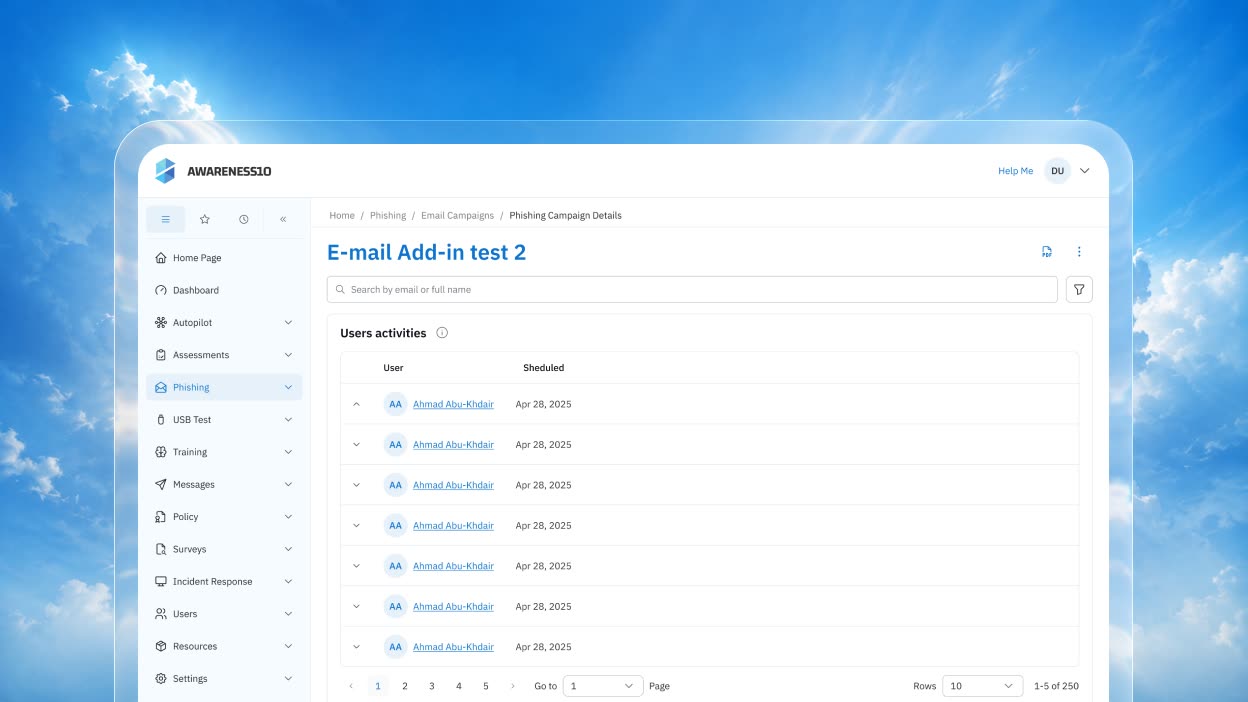
What the core reporting and campaign screens looked like before the redesign — raw counts with no scoring, no filtering, no forensic detail.
04
Approach
-
Research
Phase 01 · research Discovery
Interviewed security-awareness admins, CISOs and compliance leads, and shadowed live phishing and training programs. Found the same behavior — a repeat clicker, a chronic non-completer — being reported five different ways with no single view.
-
Information architecture
Phase 02 · information architecture Structure
campaign types reporting into one risk score
We re-modelled the org’s security posture as a single risk score, not five disconnected reports. Phishing, training, awareness, survey and attestation campaigns now all feed one behavior model — so a click on a simulated phish, a missed training deadline and a skipped attestation all move the same needle admins can watch over time.
-
Systems & leadership
Phase 03 · systems & leadership Scale
As team lead, I set the direction for four designers and built a shared component system (stat bands, filter bars, expandable rows, export toolbars) so four engineers shipped consistently across ten-plus campaign types without a fragmented UI.
-
Prototyping & validation
Phase 04 · prototyping & validation Proof
Tested the risk-score gauge and the phishing drill-down with real security admins; iterated until a risk trend and a forensic click-through both felt trustworthy at a glance.
We stopped reporting campaigns one at a time and started scoring the humans behind them.
05
The solution
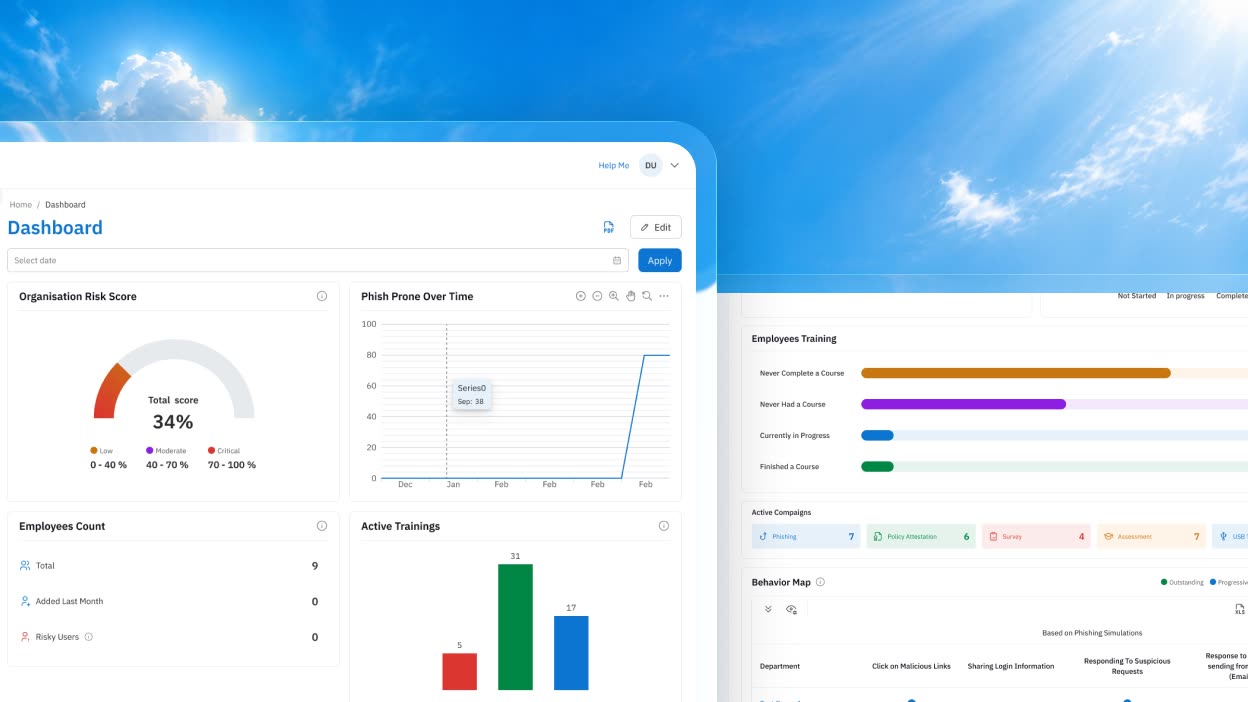
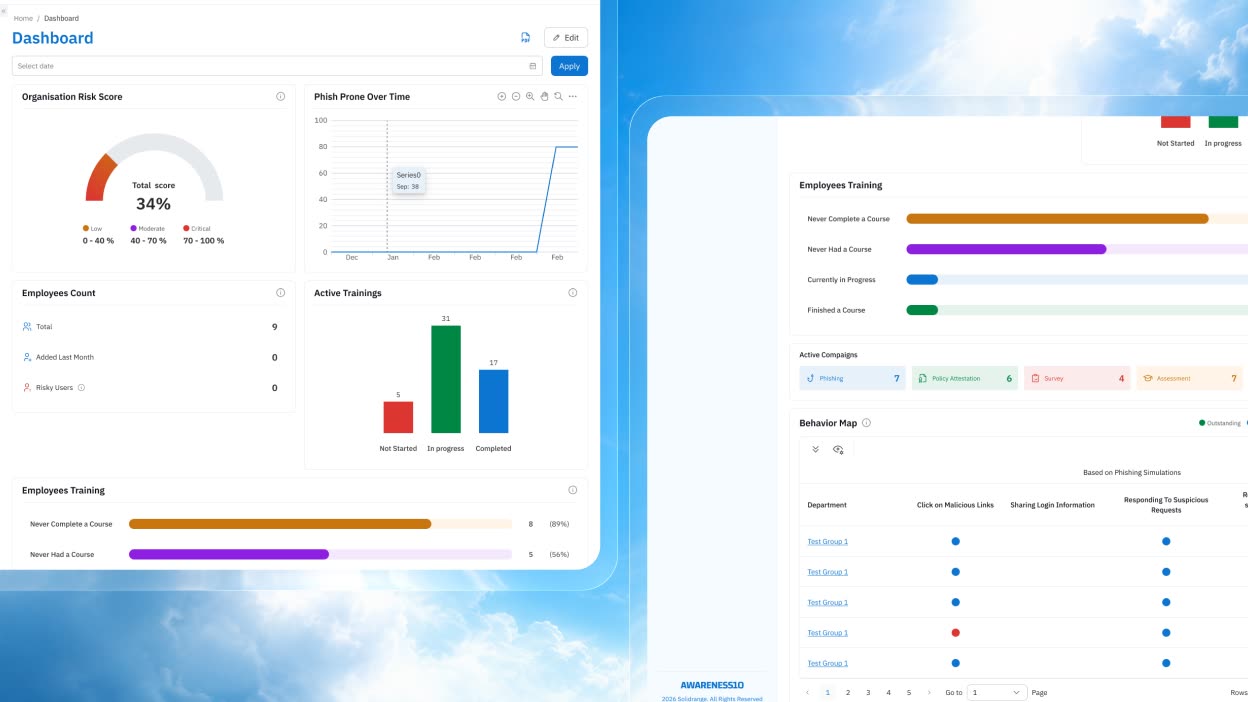
A dashboard with a real risk score
An organization risk-score gauge, a phish-prone-over-time trend and a behavior map replace raw counts — so a security lead can see, in one glance, whether the workforce is getting safer, and export the view for the board.
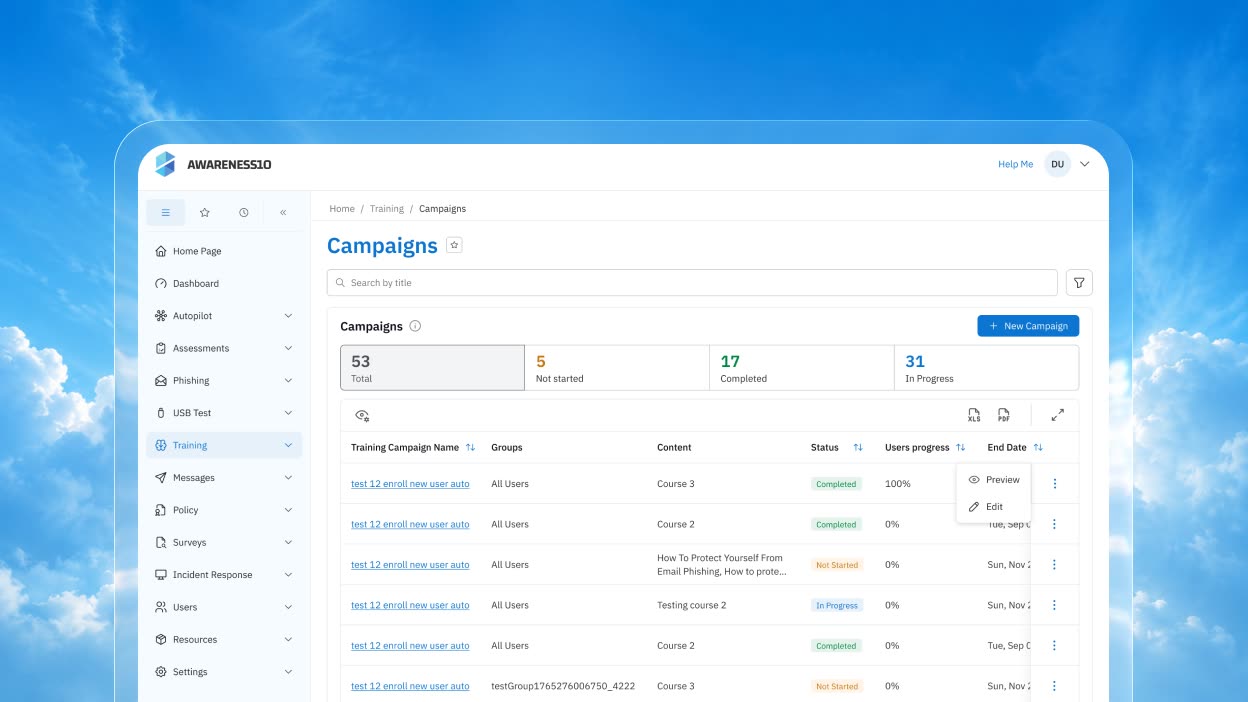
Campaigns that track themselves
Status, live progress and per-row actions turn a static campaign list into something admins operate — launch, monitor and close a campaign without leaving the table, then export results for the record.
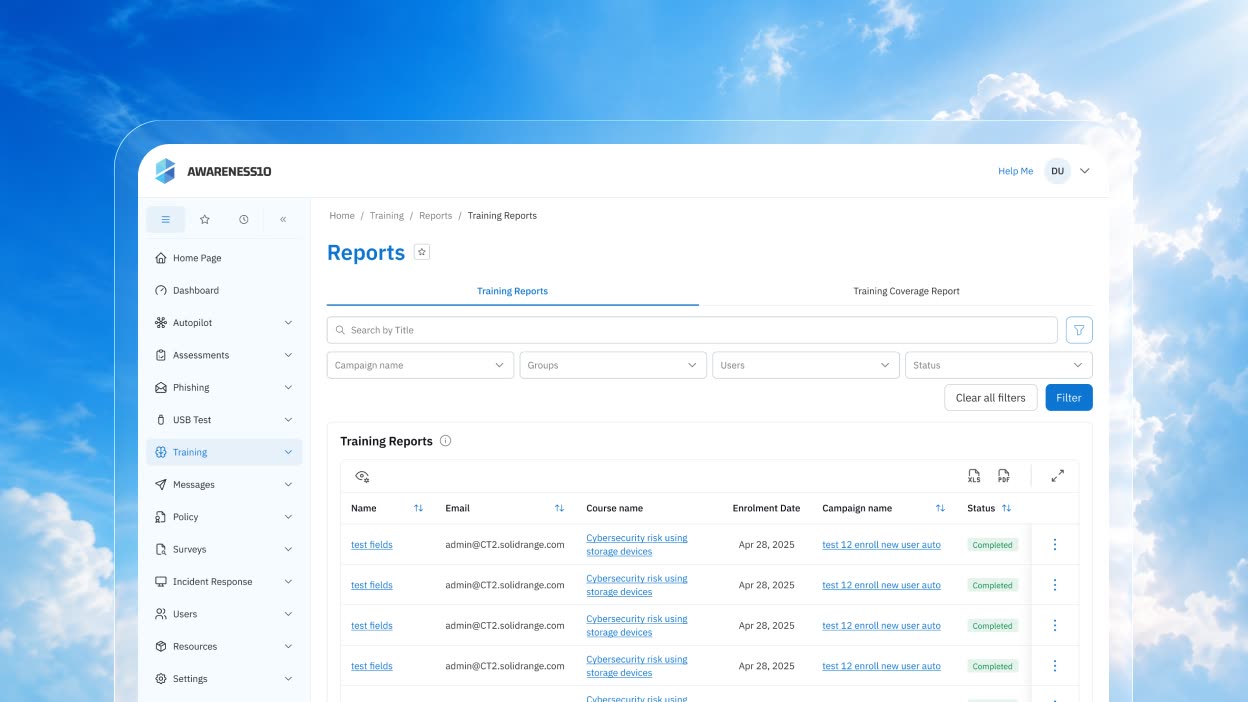
Reports that connect
Tabbed coverage views, a real filter bar and cross-linked course-to-campaign columns let an auditor answer “who’s covered?” in seconds instead of stitching screens by hand.
Forensic phishing outcomes
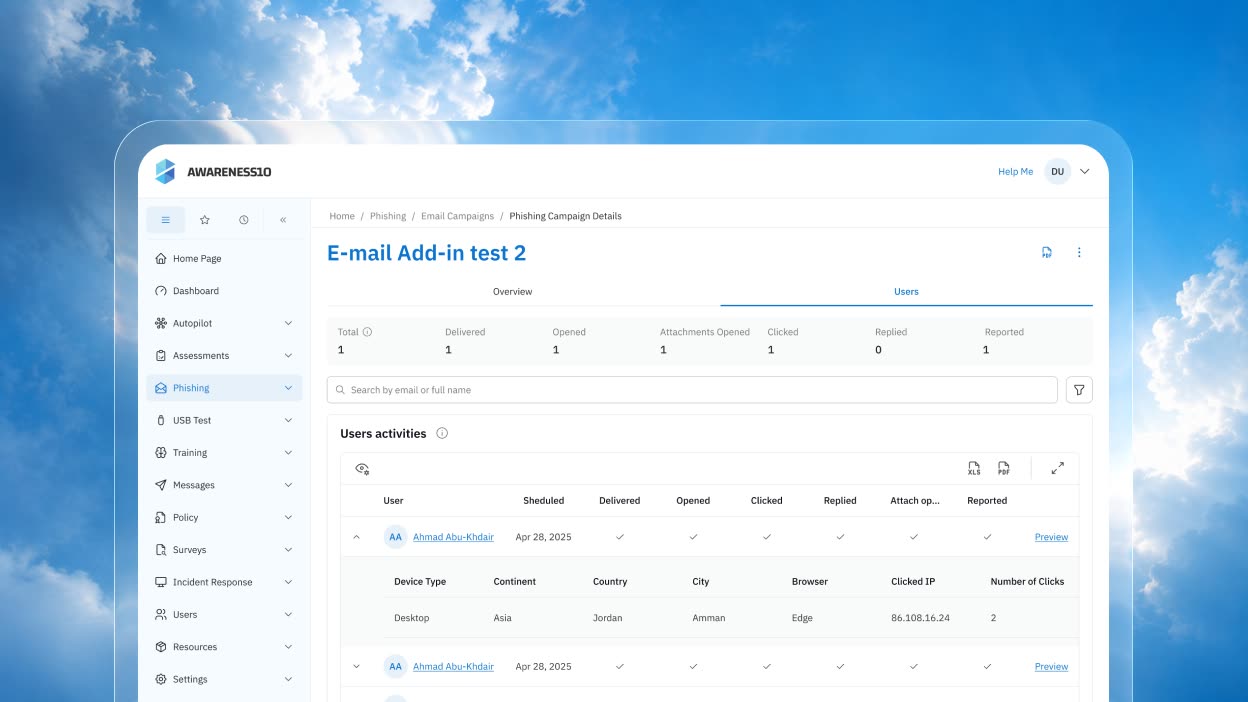
A seven-metric outcome band (delivered, opened, clicked, reported and more) plus an expandable device-and-geo drill-down turn “who was targeted” into “what actually happened” — legible enough for a five-minute standup, detailed enough for an incident review.
06
Results
Within three quarters, the platform stopped just reporting campaigns and started managing risk. Security leads could point to one number in a board meeting instead of five reports, admins launched a new phishing simulation in the time it used to take to find the last one, and the audit team pulled a coverage report in an afternoon instead of two days.
07
Reflection
Most of the effort went into deciding what to measure. Phishing results, training and attestation needed to feed a single behavior model before the dashboard, the reports and the campaign screens could show anything useful. Once that model was set, the rest of the design followed from it. Next time I would settle how behaviors get scored with engineering earlier, since every chart downstream depends on that definition staying stable.
08
Let’s Connect
Looking for a designer who can bring clarity to complex products and improve business outcomes? Let’s connect.
Download CV