Easycompliance Risk management
Rebuilding the risk lifecycle of an enterprise GRC platform — turning a set of disconnected tables into one connected system where every risk ties to its controls, assets, indicators and evidence.
01
Overview
Project info
Easycompliance is a GRC platform (governance, risk & compliance) used by enterprises in regulated industries. Risk Management is its core module — where teams identify, score, treat and monitor risk across the business. I led design for a ground-up redesign of the module, owning both the hands-on work and the design direction for a cross-functional team of four designers.
02
The challenge
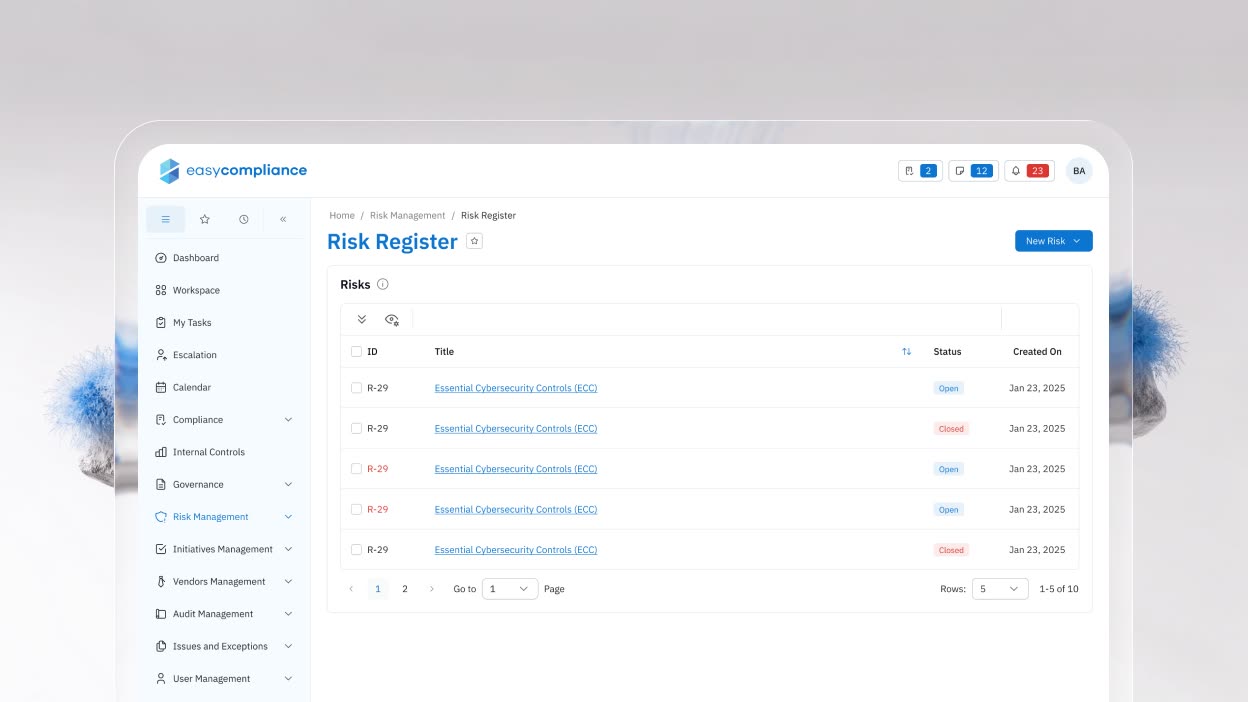
The legacy module was a stack of disconnected tables. A risk lived in isolation from the controls, assets and indicators that gave it meaning — so assessors re-entered the same data, audit prep was manual, and leadership had no trustworthy view of residual risk.
- Fragmentation
- Risks, controls, assets and issues lived in separate lists with no link between them.
- Data trust
- Scores were entered by hand and couldn’t be traced to evidence; no single source of truth.
- Scale & roles
- Analysts, risk owners and auditors shared one dense interface, and the data set was growing fast.
03
The before
What the module looked like before the redesign — disconnected tables, no shared context.
04
Approach
-
Research
Phase 01 · research Discovery
Interviewed risk managers, internal auditors and CISOs, and shadowed live assessments. Mapped the end-to-end risk lifecycle and found the same data re-keyed up to four times.
-
Information architecture
Phase 02 · information architecture Structure
objects linked to a single risk
Re-modelled the risk as a hub, not a row: a single risk now connects Controls, Assets, Key Indicators, Issues, Exceptions and Tasks. Introduced the Catalog (assets, processes, threats, vulnerabilities) and reusable Risk Libraries.
-
Systems & leadership
Phase 03 · systems & leadership Scale
As team lead, I set the direction for four designers and built a shared component system (data tables, filters, bulk import, scoring) so four engineers shipped consistently and design review stopped being a bottleneck.
-
Prototyping & validation
Phase 04 · prototyping & validation Proof
Tested the risk-detail tabs and scoring with real assessors; iterated until logging and linking a risk felt fast and trustworthy.
A risk only means something in context — so we designed the risk as a hub, not a row.
05
The solution
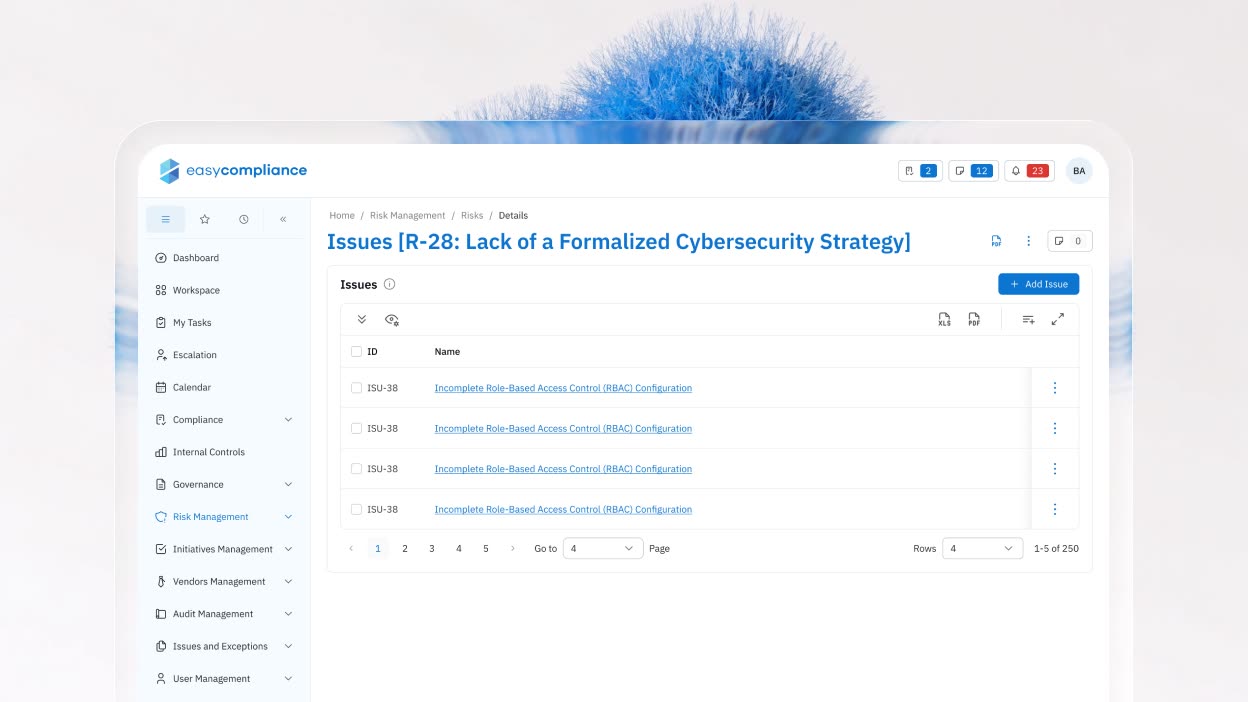
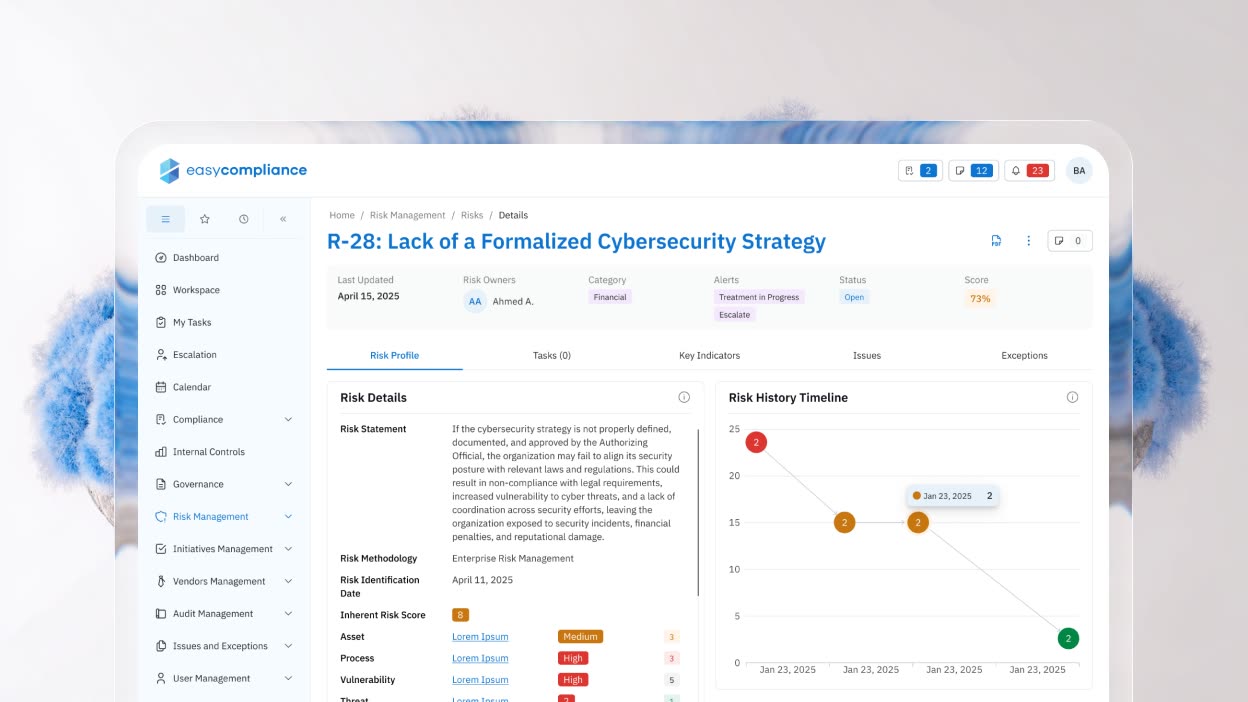
Connected risk detail
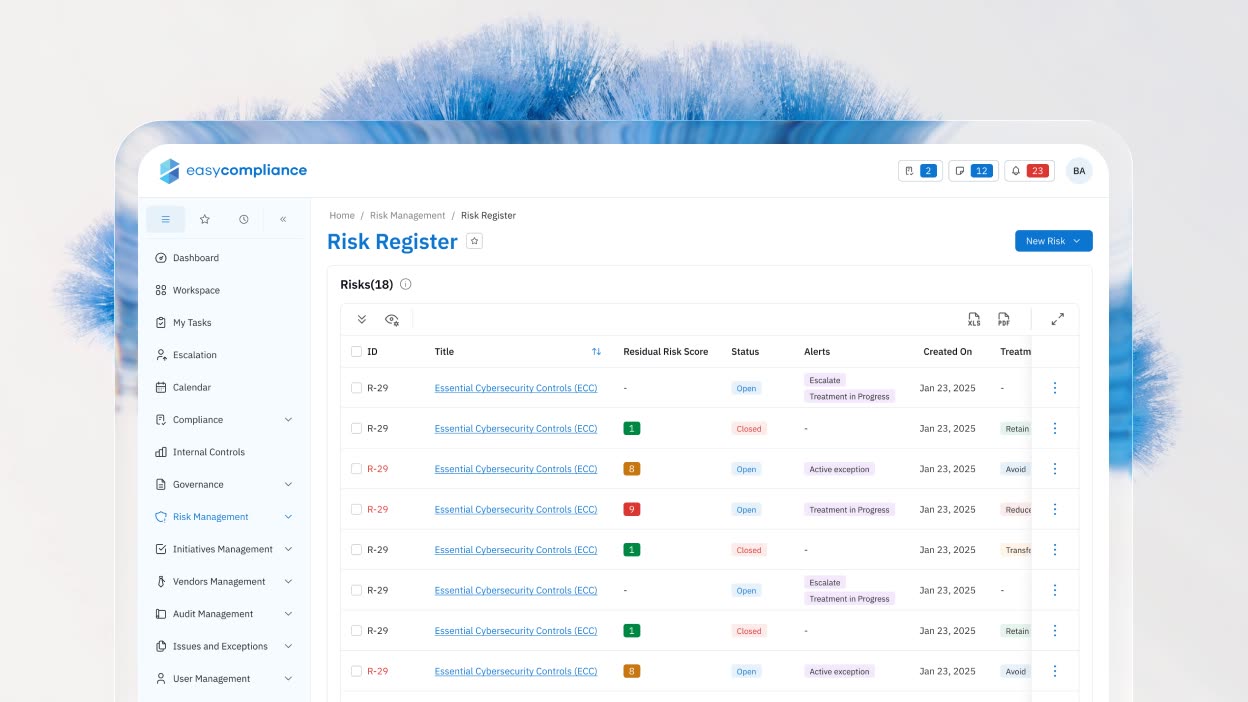
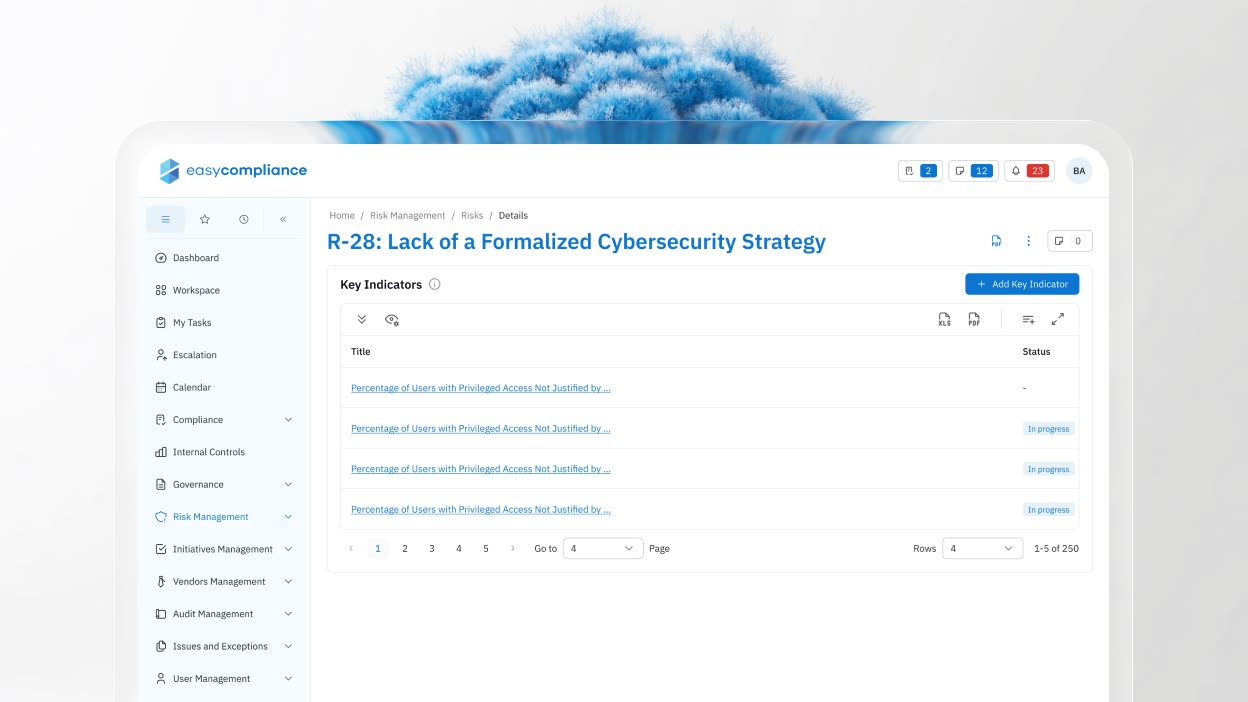
One risk, six linked views (Profile, Tasks, Key Indicators, Issues, Exceptions) with a live residual score, owners and alerts in the header. Context travels with the risk.
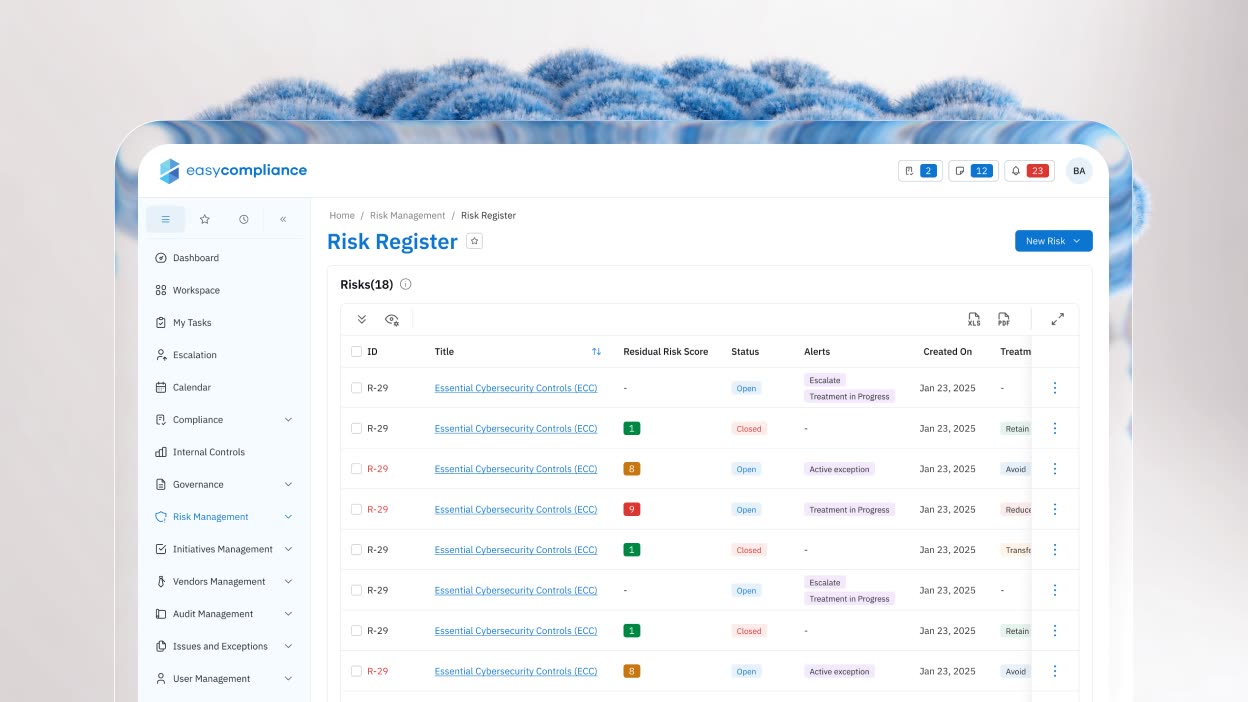
A register that reasons
Residual score, treatment method and live alerts (escalate, active exception, treatment in progress) surface in the list, with one-click export to XLS/PDF for audit.
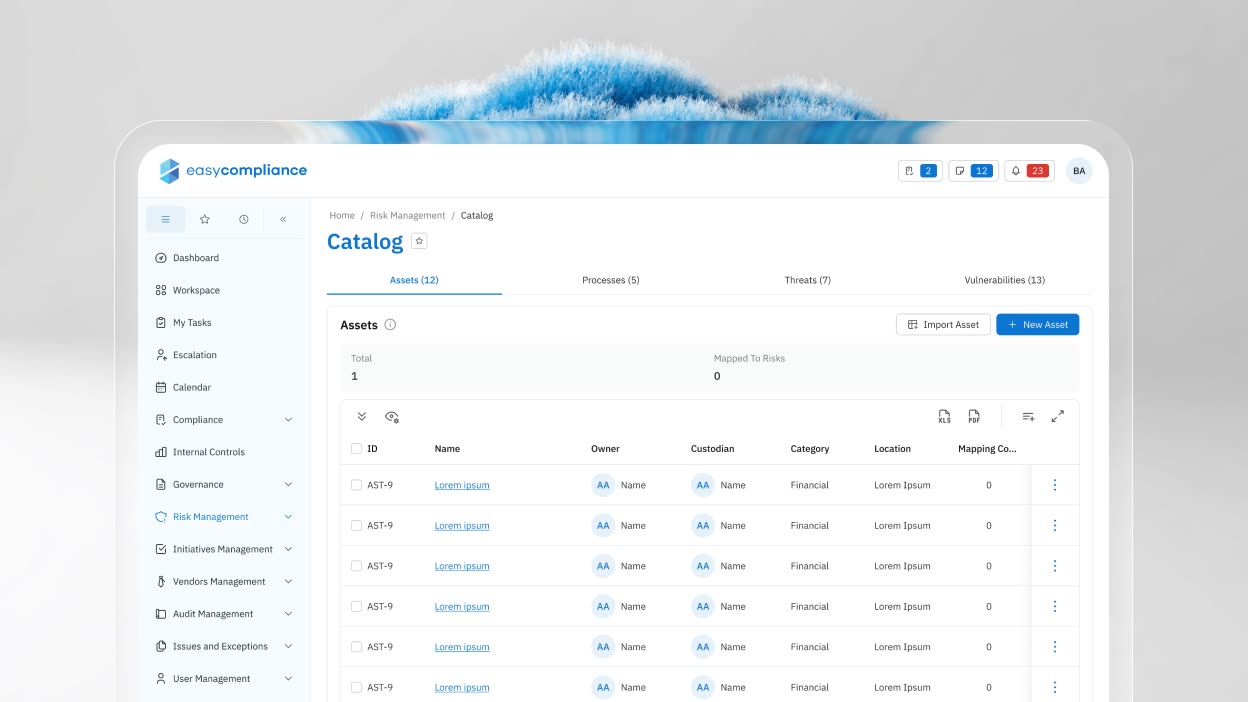
Catalog with mapping
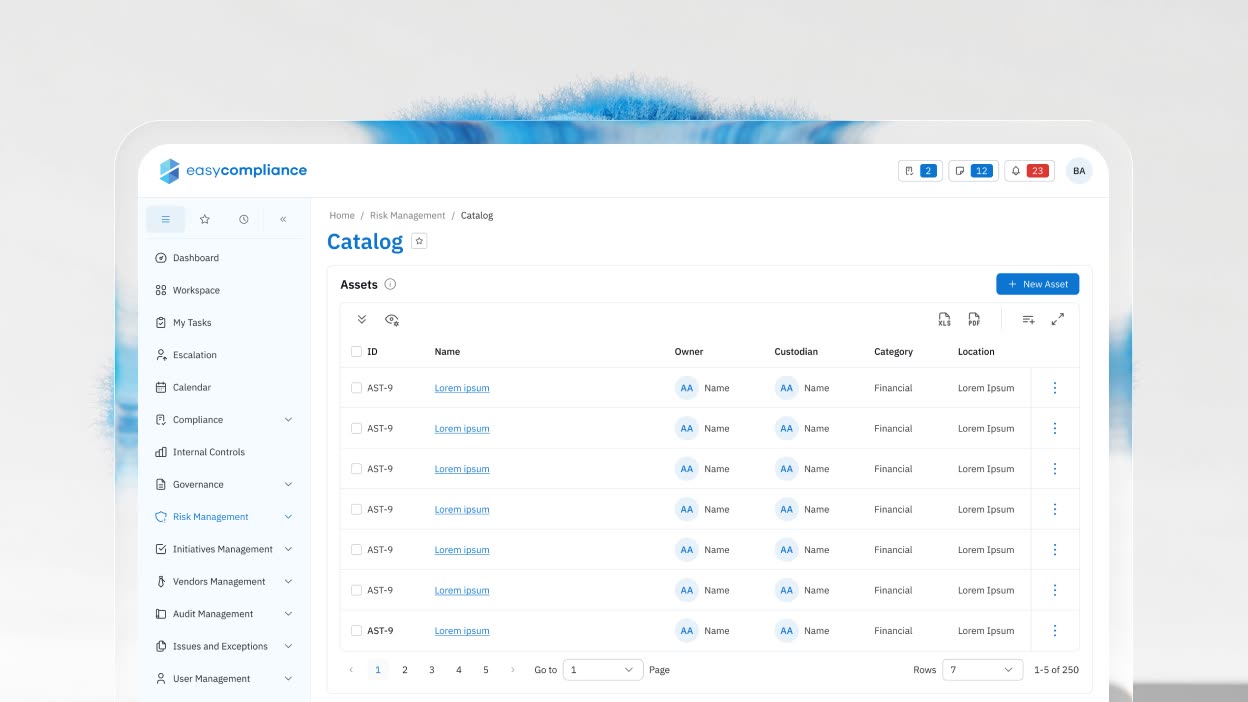
Assets, processes, threats and vulnerabilities, each mappable to risks — so coverage is visible, not assumed.
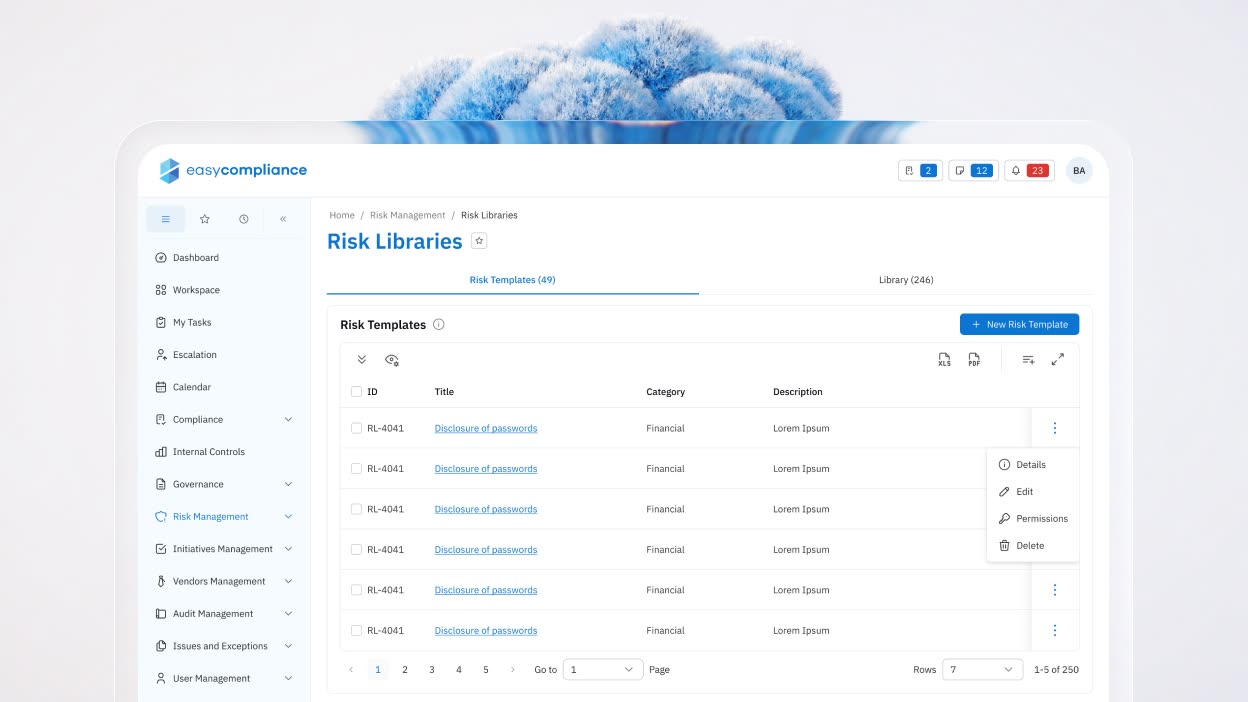
Reusable risk templates
Reusable risk templates standardise language and scoring, and cut new-risk creation from minutes to seconds.
06
Results
Within two quarters, risk work shifted from data entry to decision-making. Assessors trusted the numbers, auditors found evidence in clicks instead of emails, and leadership finally read residual risk from one place — the connected register became the system of record for the business.
07
Reflection
Doing the hands-on design while leading the team shaped how I worked on this project. The part that mattered most was the data model under the interface. After we agreed that a risk connects to its controls, assets and indicators, most of the screens became straightforward to lay out. Next time I would bring engineering into the information-architecture stage even earlier. The model only worked because we settled it before the first screen existed.
08
Let’s Connect
Looking for a designer who can bring clarity to complex products and improve business outcomes? Let’s connect.
Download CV